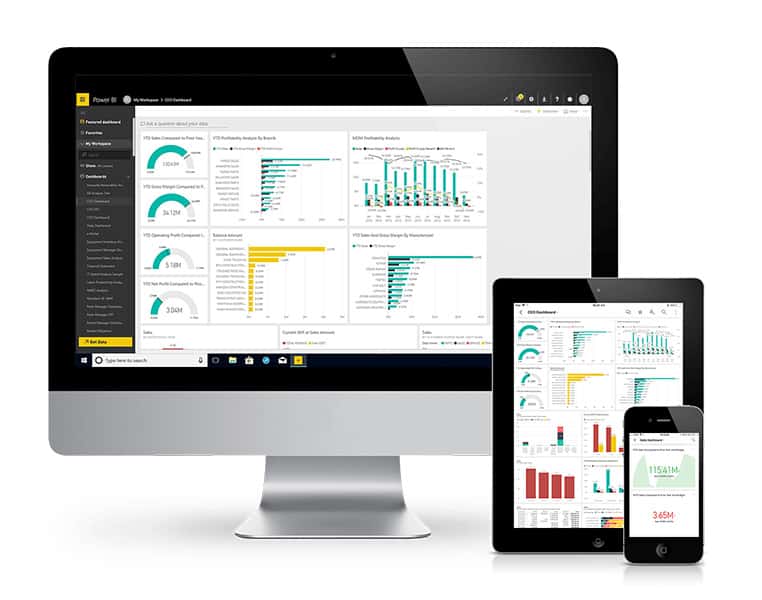
The overall health of your rental department can make or break the success of your dealership. In today’s blog post we will discuss the top 10 key performance indicators for the health of your rental department and how to monitor them with e-Emphasys ERP.
1. Rental Revenue YOY by Branch and Market Segment
Looking at the YOY of rental revenue by branch can help you identify the performance of your branches. Are they consistent, improving, or getting worse? The YOY of rental revenue by market segment can be looked at monthly and quarterly. It can help you identify which groups your dealership is performing the best with. This information can then be applied to identify more leads within that segment.
2. Rental Revenue by Equipment Category and Financial Utilization
When comparing the rental revenue by equipment category and financial utilization you will want to ensure that similar equipment types have similar financial utilizations. There may be some variation within the categories due to variations in acquisition cost for individual units. You will want to pay attention to those units so you can obtain the most optimal value for them.
3. Maintenance and Repair Costs as a Percentage of Rental Revenue Across the Entire Fleet
This should be tracked monthly and displayed on a trend line. It is important to track how expensive maintenance for the entire fleet is. This will help you notice any drastic changes to maintenance & repair costs and help you mitigate them.
4. Maintenance and Repair Costs as a Percentage of Rental Revenue Across Category Class
Tracking this will help you identify the types of equipment that are more costly to maintain than others in the fleet. That information can be used to identify if there are specific brands that cost more to maintain.
5. Maintenance and Repair Costs as a Percentage of Rental Revenue by Individual Unit
This helps you identify specific units that are more costly to maintain. This can help you search for the reason why that unit is more costly and how to mitigate those costs.
6. Maintenance and Repair Costs as a Percent of Rental Revenue by Location
The percentage should generally be the same. Locations with more units should spend more on maintenance but it should be a similar percentage relative to the number of units in their fleet. If one location is spending significantly more on maintenance as a percentage of rent revenue, this may be a cause of concern.
7. Damages Charged Against Loss Damage Waiver
The Loss Damage Waiver is not 100% profit. There should be entries from the service department to restore costs to the rental department. This ensures that every department shares in these anticipated costs on the books.
8. Time Utilization Monthly Trends by Equipment Category
This analysis helps you determine which categories of equipment are out on rent. If you have a high time utilization paired with a high financial utilization, it may be time to invest in more units. If a high time utilization coincides with a low financial utilization, that might indicate the need to raise rental rates.
9. Time Utilization Monthly Trends by Equipment Class
Similar to the Time Utilization Trends by Equipment Category, this analysis can be used to determine which classes of equipment are out on rent. This can help determine opportunities to invest in classes of equipment based on financial and time utilization.
10. Time Utilization Trends by Branch Location
This analysis displays which branch locations have more units out on rent overall. This can help you determine which locations may want to invest in new units, or if there is an opportunity for units to be moved within locations to better meet customer needs.
If you would like to see how tracking these KPI’s, and metrics across your dealership with e-Emphasys can benefit your business you can schedule a demo here. If you are interested in the overall results and benefits that our dealer management platform can help you achieve, check out our Efficiency and Results Success Story Video to hear from our happy customers first-hand.
